


.png#keepProtocol)


 I read Antti Ilmanen’s book recently, “Investing Amid Low Expected Returns.” Ilmanen, like many other observers, expects low real returns from stocks, bonds and many other assets going forward.
Those low returns raise interesting questions. But one that matters a lot to retirees? How much can you safely draw if, going forward, stocks, bonds and other assets deliver a real return roughly half their historical average. So maybe for stocks something like 3 or 3.5 percent rather than 7 percent.
A great question. But a question hard to answer. And for a simple reason. We don’t have much historical data to use for modeling what works safely when investors should expect low returns.
In fact, I count two examples where investors should have expected low returns going forward: Right before Black Tuesday in October 1929. And then in the late 1990s before the dot-com crash.
But that’s not enough to generalize. The 1929 scenario probably did fail for 100 percent stock portfolios if someone started in 1929 and withdrew 4 percent. (A balanced portfolio probably didn’t.)
And for those retirements that start in say 1999 or 2000? We don’t know yet. We haven’t had a full thirty years of data. (Those retirees do look to be in pretty good shape so far.)
Thus, this idea: Maybe we use a Monte Carlo simulation. And calculate not historical safe withdrawal rates. But Monte Carlo safe withdrawal rates.
The attraction there? We need just a couple of pieces of data: The arithmetic mean return expected. And then a standard deviation.
But with those two values, we can get an idea as to how much one might draw in a worst-case situation in a low-expected-returns environment.
Conveniently, the Red Portfolio Black Portfolio spreadsheet I constructed recently for a blog post last year (see below) will let you do that.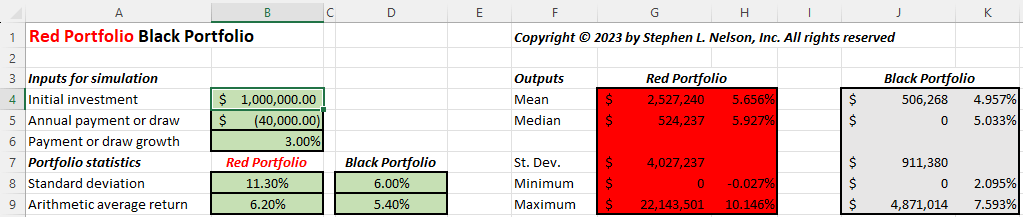
You can download a free copy here: RedPortfolioBlackPortfolioVer1. And then you just follow these steps:
- Specify the starting balance into cell B4,
- Enter a negative value into the cell B5 to show the probable starting withdrawal amount.
- Specify the percent increase in the draw using cell B6. (This is essentially the inflation rate.)
- Enter the standard deviation for your primary “Red” portfolio into cell B8 and the arithmetic mean return into cell B9. Back of the envelope calculations, which I’ll describe in a minute, suggest an arithmetic mean return of maybe 6.2% for a balanced portfolio of 70% stocks and 30% bonds like you might use for retirement? That portfolio’s standard deviation probably roughly equals 11.3%?
- The spreadsheet uses a second standard deviation and arithmetic mean as a benchmark “Black” portfolio for comparison. For now, enter the Black Portfolio standard deviation as 6% and its arithmetic mean as 5.4%. These values represent my guess of what a 100% Treasury Inflation Protected Securities (aka TIPS) portfolio would show. But more on that in a few paragraphs.
Can I also throw out a tangential comment? I think given the purpose of this Monte Carlo simulation, you use rounded whole percentages. Like maybe 11 percent and 6 percent from the Red and Black Portfolio’s standard deviations. And then maybe 6 percent and 5 percent for the arithmetic averages. Those rounded percentages might be good reminders that what we’re doing here? A learning thing. Not hardcore research for some academic study.
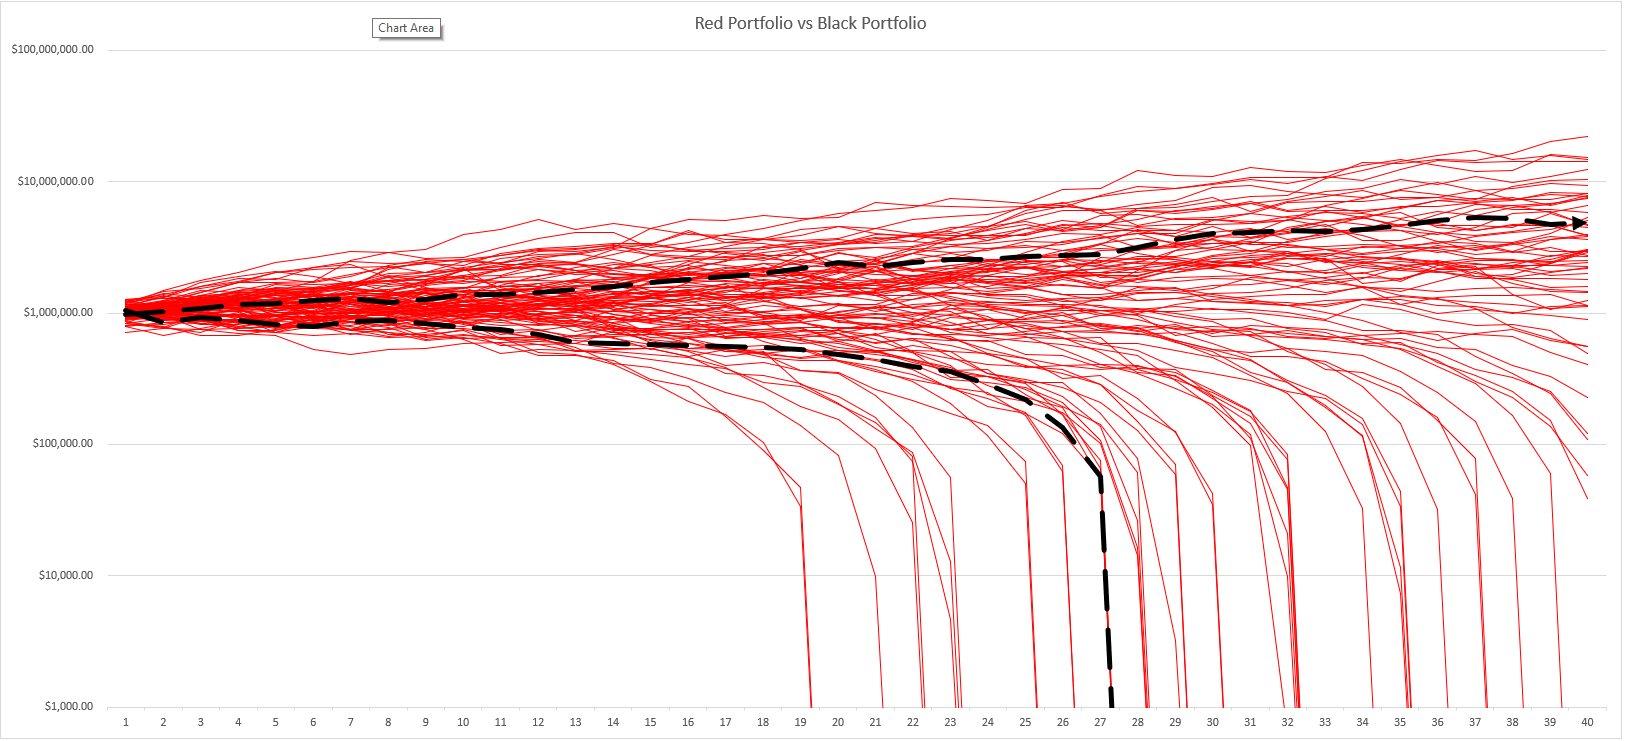
Once you get the inputs entered, Excel recalculates the workbook and plots 100 simulation results for the Red Portfolio using red lines. It also plots the best and worse scenarios from another 100 simulation results for the Black Portfolio using thick, black dashed lines.
A line chart that uses the inputs above appears below. And what the line chart suggests? A 4 percent withdrawal looks risky. Those red lines dropping down to zero? Those signal failure scenarios. You can experiment a bit. I think you’ll find your Monte Carlo safe withdrawal rate looks more like 3% to 3.5% if you’re talking a three-decade retirement funded by a balanced portfolio. So, making the math easy, with a $1,000,000 to start, a starting draw of $30,000 to $35,000.
I designed the Red Portfolio Black Portfolio spreadsheet so someone can compare one portfolio’s simulations (the Red Portfolio) to the best and worst outcomes of another portfolio (the Black Portfolio).
That begs a question, which is what do you use as the alternative when you’re thinking about safe withdrawal rates in a low expected returns environment? I wondered about this bit. And then realized the Bogleheads, or some of them, already have a go-to idea. Worried about low returns requiring a low safe withdrawal rate? Just use Treasury Inflation Protected Securities or TIPS.
That makes sense as a hunch. So for fun, I estimated the nominal arithmetic mean return on TIPS as equal 5.4% based on the the fixed interest rate (2.2%) for TIPs the day I drafted this article and a 3% inflation rate, and then the historical standard deviation (6%) . Note that the spreadsheet calculates and works with nominal returns which means you need to adjust the real return TIPS deliver (so the 2.2% in the earlier example) for the inflation you anticipate.
The worst and best case scenarios for this TIPS portfolio show up in those thick black dashed lines in the chart shown earlier. Interestingly, as the line chart shown illustrates, you can fail with a 4% withdrawal rate. But a 100% TIPS portfolio also might not fail even after 40 years.
Again, I used inputs that suggest more precision than is probably appropriate. I’d say go with rounded whole percentages if that makes you feel better.
Obviously, the trick here is coming up with good arithmetic returns and standard deviations. And for portfolios like the ones you want to understand. Wade Pfau provides an online resource you can use for some of this information (see here.)
For a balanced portfolio’s expected returns, you need to go to a little bit of effort to get the numbers you need. But here’s how I’d approach the work. I think you use the 3.5% geometric mean Illmanen expects for US stocks as your expected return for that part of your portfolio. That number, he calculates as the sum of the 1.5 percent growth in earnings per share plus the 2 percent-ish dividend yield. If one adds two to three percent for inflation, you’re at 5.5 to 6.5 percent as a nominal geometric return. So maybe we split the difference and say a 6 percent nominal return on stocks.
Ten-year treasuries return (roughly) 4.7 percent as I write this and maybe represent a guess for that part of your portfolio? Thus, if you go with 70 percent in stocks generating 6 percent and 30 percent in bonds generating 4.7 percent, your portfolio earns a geometric return of roughly 5.6%. To roughly convert that geometric mean to an arithmetic mean, add one half of the squared standard deviation, which Portfolio Visualizer suggests is around 11.3%, and the adjustment equals .6%. That gives you basically 6.2% arithmetic return.
For the 100% TIPS portfolio, I’d look at today’s real yield (roughly 2.2% as I write this), add a 3% inflation guess to this to get a geometric return of 5.2.%-ish and again bump up this geometric return by one half of the 6-percent-ish squared standard deviation. That’s about a .18% adjustment. Which means to model TIPS, you use a roughly 5.4% arithmetic mean and a 6%-ish standard deviation.
Note: If you have questions about the spreadsheet including questions about how to convert geometric means to arithmetic means, refer to its FAQ: Red Portfolio Black Portfolio FAQ.
Some closing remarks. First, simple Monte Carlo simulations suggest that the old four percent rule of thumb won’t work 95 percent of the time with a balanced portfolio. You and I are probably looking at something closer to three percent if we invest on the basis of a 95 percent success rate. (That would be especially true for members of the FIRE community who want to fund not three decades of retirement but four or more decades.)
Second, even in a world of low expected returns, most people probably can draw more than whatever the Monte Carlo simulation shows as the lowest rate that doesn’t fail more than about 5 percent of the time. (This was always the case with the 4 percent safe withdrawal rate too, right?) So keep that in mind. The theoretical very worst-case scenarios are something you and I need to plan for a little bit. But those outcomes are unlikely.
A third comment straight out of from Ilmanen’s book. His obvious conclusion regarding low expected returns? We may want to save more if we can. Maybe work longer if that’s an option. Or possibly we will need to spend less if we experience a batch patch of returns in retirement. But mostly? We just need to understand returns going forward probably won’t be as good as they’ve been. And forewarned? Yeah, we can make this work.
And, finally, a fourth comment: The TIPS option seems pretty interesting.

.png#keepProtocol "The Key to Boosting Retention")
More Stories
Employee Appreciation Day: How to build a culture of year-round recognition
Data Never Sleeps Turns 11!
George Jenkins’ Alyssa Currie signs first bowling scholarship in school history